Estimated reading time 1 minute, 27 seconds.
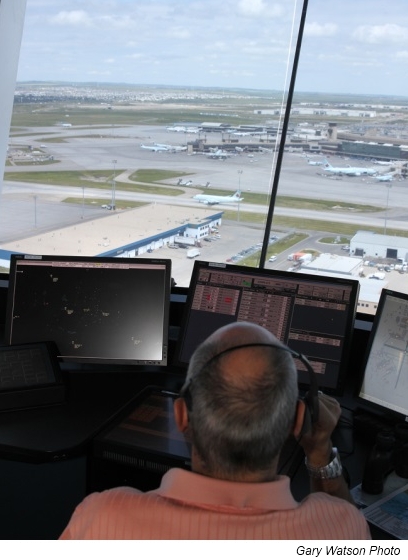
The 5,455,203 takeoffs and landings at 93 Canadian airports with Nav Canada control towers and/or flight service stations last year was down by 103,144, or 1.85 per cent, from 2012. The fifth consecutive overall decline, last year’s slippage included 3,965,711 “itinerant” movements between airports, down 66,875 or 1.66 per cent from 2012; and 1,525,761 local movements, down 36,279 or 2.4 per cent.
Air carriers accounted for 3,119,174 of the itinerant movements in 2013, down 52,124 or 1.6 per cent from 2012, while other commercial operations increased by 1,961 or 0.7 per cent to 302,039 movements. Other traffic was down from 2012, including 423,797 private aircraft takeoffs and landings, down 8,321 or 1.9 per cent. Overall government traffic in 2013 included 73,575 civil movements, down 6,125 or 7.7 per cent, and 46,326 military movements, down 3,066 or 6.2 per cent.
In the local mix—aircraft which remained within the vicinity of the airports from which they took off—civil traffic accounted for 1,518,497 movements in 2013, down 36,460 or 2.4 per cent from 2012, while military movements increased by 191 or 2.6 per cent to 7,455.
Among airports with Nav Canada towers, Toronto/Lester B. Pearson International (YYZ) and Vancouver International (YVR) continued to top the ranks last year, with 433,610 and 301,725 movements, respectively. YYZ traffic was down by approximately 0.5 per cent from 2012, while YVR was up by about the same percentage.
